User Guide/Debugger: Difference between revisions
initial import |
No edit summary |
||
| (One intermediate revision by one other user not shown) | |||
| Line 1: | Line 1: | ||
{{DISPLAYTITLE:{{SUBPAGENAME}}}} | |||
{{User Guide}} | |||
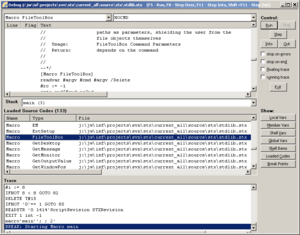
The {{STX}} debugger is a very useful application if you are writing {{STX}} scripts. | |||
[[File:dbg_overview.png|thumb]] | |||
==Break Points== | |||
Displays all defined break points. Break points are points in the code where the debugger will automatically stop at if reached whilst running. | |||
==Loaded Codes== | |||
Displays a list of all macros, classes and spus currently loaded in {{STX}}. Double-clicking on a code item displays the corresponding code in the window source code window above. | |||
==Debugger Hotkeys== | |||
Ctrl+R, F5 = run | |||
Ctrl+S, F8 = step (over) | |||
Ctrl+I, F11 = step into | |||
Ctrl+O, Ctrl+F11 = step out | |||
Ctrl+B = set / clear breakpoint at current line of source listing | |||
Ctrl+A = clear all breakpoints | |||
Ctrl+1 = switch to local var-list | |||
Ctrl+2 = switch to member var-list. | |||
Ctrl+3 = switch to shell var-list | |||
Ctrl+4 = switch to global vars-list | |||
Ctrl+5 = switch to item-list | |||
Ctrl+6 = switch to code-list | |||
Ctrl+7 = switch to breakpoint-list | |||
==Shell Items== | |||
A list of all instances of shell items currently available in this shell. Double-clicking on an item will display it if possible (i.e. if it is not locked and their is a display method for it). | |||
==Variables== | |||
You can view all the variables currently defined in the debugger. Double clicking on a variable allows you to edit its value. | |||
====Local Vars==== | |||
Lists all variables and variable values in the local namespace. | |||
====Member Vars==== | |||
Lists all member variables in the active instance. If no instance is active, nothing is shown. | |||
====Shell Vars==== | |||
Lists all shell variables and their values in the active shell. | |||
====Global Vars==== | |||
Lists all global variables and their values. | |||
Latest revision as of 12:51, 3 September 2015
The STx debugger is a very useful application if you are writing STx scripts.

Contents
Break Points
Displays all defined break points. Break points are points in the code where the debugger will automatically stop at if reached whilst running.
Loaded Codes
Displays a list of all macros, classes and spus currently loaded in STx. Double-clicking on a code item displays the corresponding code in the window source code window above.
Debugger Hotkeys
Ctrl+R, F5 = run
Ctrl+S, F8 = step (over)
Ctrl+I, F11 = step into
Ctrl+O, Ctrl+F11 = step out
Ctrl+B = set / clear breakpoint at current line of source listing
Ctrl+A = clear all breakpoints
Ctrl+1 = switch to local var-list
Ctrl+2 = switch to member var-list.
Ctrl+3 = switch to shell var-list
Ctrl+4 = switch to global vars-list
Ctrl+5 = switch to item-list
Ctrl+6 = switch to code-list
Ctrl+7 = switch to breakpoint-list
Shell Items
A list of all instances of shell items currently available in this shell. Double-clicking on an item will display it if possible (i.e. if it is not locked and their is a display method for it).
Variables
You can view all the variables currently defined in the debugger. Double clicking on a variable allows you to edit its value.
Local Vars
Lists all variables and variable values in the local namespace.
Member Vars
Lists all member variables in the active instance. If no instance is active, nothing is shown.
Shell Vars
Lists all shell variables and their values in the active shell.
Global Vars
Lists all global variables and their values.