User Guide/Spectrum Viewer: Difference between revisions
From STX Wiki
Jump to navigationJump to search
No edit summary |
No edit summary |
||
| Line 1: | Line 1: | ||
{{DISPLAYTITLE:{{SUBPAGENAME}}}} | {{DISPLAYTITLE:{{SUBPAGENAME}}}} | ||
{{V3}} | {{V3}} | ||
[[file:stx_ug_spectrum_viewer.png|thumb]] | |||
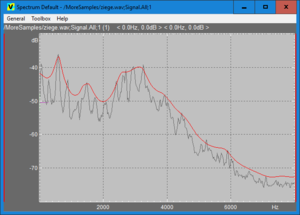
The Spectrum Viewer application computes and displays the averaged spectra as defined by the [[User Guide/Spectrum Viewer/Settings|spectrum settings]]. The spectra can be saved in the project. | The Spectrum Viewer application computes and displays the averaged spectra as defined by the [[User Guide/Spectrum Viewer/Settings|spectrum settings]]. The spectra can be saved in the project. | ||
Revision as of 10:41, 12 October 2015
The Spectrum Viewer application computes and displays the averaged spectra as defined by the spectrum settings. The spectra can be saved in the project.
Contents
Methods
The Spectrum Viewer implements the following analysis methods:
Settings
You can setup your spectrum analysis in the Settings dialog, available if you double click a Spectrum Viewer profile in the Workspace.
Pre-Configured Profiles
- Default
- CEP Spectrum Magnitude
- LPC Spectral Magnitude
Hotkeys, Context Menu, Copy & Print Dialog
The available hotkeys are documented here. The context menu is documented here. The Copy/Print dialog is documented here.
