User Guide/SPExL/Transcription Script: Difference between revisions
| Line 23: | Line 23: | ||
==Spectrogram / Waveform Views== | ==Spectrogram / Waveform Views== | ||
You can display either a spectrogram or a waveform of the sound file (or both). Since the waveform draws fastest, this is available on it's own ('''wave only'''), and can display the whole file. The spectrogram graph, which takes longer to calculate, displays only a section of the file at a time, with the ability to scroll through the file ('''wave & spg. section'''). | |||
===wave overview & spg. section=== | ===wave overview & spg. section=== | ||
This view displays a waveform of the whole file and a spectrogram of a section of that file. This means that you can see all the segments in the file in the waveform graph. Navigating around the file in the waveform, you can then view a section of it as a spectrogram (e.g. with the hotkey 'S'). | This view displays a waveform of the whole file and a spectrogram of a section of that file. This means that you can see all the segments in the file in the waveform graph. Navigating around the file in the waveform, you can then view a section of it as a spectrogram (e.g. with the hotkey 'S'). | ||
Revision as of 08:56, 11 December 2017
The 'Transcription' script is a tool in STx specifically written for transcribing sound files. The idea is to make transcribing as simple and efficient as possible. In addition to using the mouse, you can do the transcribing with the keyboard alone. The hotkeys are user-definable.
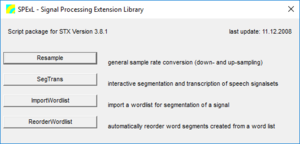
The 'Transcription' script is a tool in STx specifically written for transcribing signals. You will find it in the bottom left-hand corner of the Workspace where it is called Transcription.
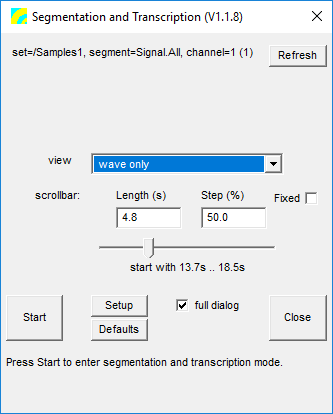
When starting the Transcription script, you must select the sound file in the Workspace you wish to transcribe. This is unlike the analysis profiles, which analyse a segment. The following dialog will then appear.
Here you have the choice to choose which 'view' you would like.
- wave overview & spg. section
- A waveform overview of the whole sound file and a spectrogram graph of a section of the sound file.
- wave only
- Displays a waveform plot of a section of the sound file, with the possibility to 'scroll' through the sound file. The length of the displayed signal is defined the the 'scrollbar Length'.
- wave & spg. section
- Displays both a waveform and a spectrogram plot of a section of the selected sound file. As with the 'wave only' view, the section length is defined by the 'scrollbar Length'.
Spectrogram / Waveform Views
You can display either a spectrogram or a waveform of the sound file (or both). Since the waveform draws fastest, this is available on it's own (wave only), and can display the whole file. The spectrogram graph, which takes longer to calculate, displays only a section of the file at a time, with the ability to scroll through the file (wave & spg. section).
wave overview & spg. section
This view displays a waveform of the whole file and a spectrogram of a section of that file. This means that you can see all the segments in the file in the waveform graph. Navigating around the file in the waveform, you can then view a section of it as a spectrogram (e.g. with the hotkey 'S').
wave only
The wave only view displays a section of the signal as a wave form. The length of signal displayed is specified by the Length value in the start-up dialog. You can then scroll through the sound file using, for example, the hotkeys 'M' (forwards) and 'N' (backwards).
wave & spg. section
This view also only displays a section of the sound file. The waveform and spectrogram are time-aligned.
F0 / Formant Extraction
You can display the F0 and formants in the spectrogram by pressing the ![]() button. The settings for extraction are in the F0 / Formant Extraction Settings dialog reached by pressing the 'f0/for' button
button. The settings for extraction are in the F0 / Formant Extraction Settings dialog reached by pressing the 'f0/for' button ![]() .
.
Settings
There are many aspects of SPExL that you can change via the Settings dialog reached by the 'main' ![]() button, or the 'settings->setup dialog' context menu.
button, or the 'settings->setup dialog' context menu.
Hotkeys
Note that unless otherwise specified (e.g. with 'Shift'), all hotkeys are lowercase.
Analyze Hotkeys
| Ctrl+N | Select a viewer and profile to analyze the signal between the cursors with (opens new window). |
| Ctrl+A | Analyze the signal between the cursors with the viewer/profile which was used last. |
Cursor Hotkeys
| Key | Description | W. Overview & Spg. Section | Wave only | W.&S. Section |
|---|---|---|---|---|
| B | Move the cursors to the selected segment. | X | X | X |
| D | Move left cursor to the left. | |||
| F | Move left cursor to the right. | |||
| E | Move left cursor to the left in large steps. | |||
| R | Move left cursor to the right in large steps. | |||
| J | Move right cursor to the left. | |||
| K | Move right cursor to the right. | |||
| U | Move right cursor to left in large steps. | |||
| I | Move right cursor to right in large steps. | |||
| L | Flip left cursor around right cursor. | |||
| Shift + L | Flip right cursor around left cursor. | |||
| Ctrl + Y | Rotate through the available cursor styles. |
Playback Hotkeys
| Escape | Stops playback |
| Space | Play between the cursors |
| A | Play all of signal in waveform window |
| O | Play all of the signal from the right-hand cursor to end of waveform window |
| P | Play the selected segment |
| W | Play all of signal up to the left-hand cursor |
Scrollbar Hotkeys
The length scrolled is defined when SPExL starts up (Scrollbar Step (%)).
| Ctrl + G | Jump top a position specified in seconds |
| M | Scroll forward |
| N | Scroll backwards |
Segment Hotkeys
| Shift + B | Move the selected segment to the cursor positions. |
| Enter | Create new segment between the cursors. |
Segment List Hotkeys
| Ctrl + R | Open the segment list sort order dialog. |
| Ctrl + Numpad Plus | Resize all columns to fit their content |
Spectrogram Hotkeys
| Shift + Add | Increase amplitude floor. |
| Shift + Subtract | Decrease amplitude floor. |
Zoom Hotkeys
| Y | Zoom in on the x axis around the mid point between the cursors. |
| Q | Zoom out on the x axis around the mid point between the cursors. |
| Ctrl + Add | Zoom in on the y axis around the active cursor |
| Ctrl + Subtract | Zoom out on the y axis around the active cursor |
| V | Zoom between cursors on the x axis |
| Shift + V | Zoom between cursors on the y axis. Note that this only works if the cursor style allows y axis positioning. |
| G | Zoom in around the left-hand cursor. |
| T | Zoom out around the left-hand cursor. |
| H | Zoom in around the right-hand cursor. |
| Z | Zoom out around the right-hand cursor. |
| X | Reset the zoom |
Misc Hotkeys
| Key | Description | W. Overview & Spg. Section | Wave only | W.&S. Section |
|---|---|---|---|---|
| S | Redraw the spectragraph graph showing the signal between the cursors in the waveform graph. | X |
Versions
Note that versions > 1.0 require STx >= 4.4
1.1.7
- bugfix: the /U ASegTemplate flag is now respected, and, if used, the last entered value for a segment attribute is used as the default for the next new segment.
1.1.5
- bugfix: segment placement algorithm no longer drawing segments off screen.
- bugfix: moving scrollbar no longer generates an error message in the log window.
Download Transcription script downloads.

