Spectrogram methods
Contents
Spectrogram methods
A number of different spectrogram types are available.
cepstrum smoothed
Computes the cepstrum smoothed amplitude spectrum, via the inverse transform of the low-pass filtered cepstrum.
cepstrum coefs.
Number of cepstrum coefficients which should be used to compute the smoothed spectrum. If this value is set to zero the number of cepstrum coefficients is set to: lfrm0.5 (with: lfrm = frame length in samples).
wigner distribution
Compute the smoothed pseudo Wigner distribution (SPWD).
smoothing
Smoothing length.
fir-length
Length of FIR filter for the computation of the analytical signal.
unit
Unit for smoothing and FIR filter length.
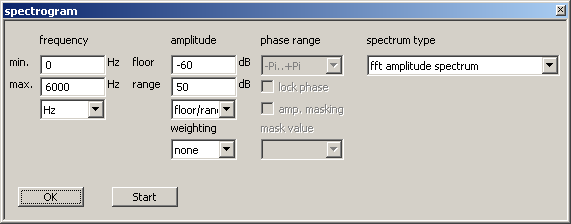
FFT amplitude spectrum
Compute the FFT-amplitude (dB). The amplitude is displayed in the color palette selected by the profile's color scheme. Equally spaced color-steps for the defined amplitude range are used. The first and last color-step is also used for values outside the display range.
This following settings are used by almost all spectrogram method types:
frequency scale settings
This setup group is used by all spectrogram types. The controls below the text frequency define the frequency scale of the spectrogram. The minimum and maximum frequency (min., max.) are values in Hz. The combobox selects the frequency scale unit to use. Currently the following units are supported:
Hz, kHz, Bark, Octave, 1/2 Octave, 1/3 Octave and ERB.
amplitude scale settings
The controls below the text amplitude defines the amplitude scale of the spectrogram. All amplitude values are specified in dB. The combobox selects if floor and range (amplitude scale from floor-range to floor) or minimum and maximum (amplitude scale from min to max) should be used. This setup group is used by all amplitude spectrograms.
min/max, floor/range, auto/range, auto
The amplitude range can be specified using minimum and maximum values, a floor and a range, a floor with an automatically calculated range based on the signal's content, or completely automatically.
weighting - none|A|C|Hth|FM(phon)
The Hth is a weighting based on the hearing threshold. The FM(phon) weighting is the Fletcher-Munson equal-loudness. Note that the Hth and FM(phon) weightings only make sense if the signal is calibrated.
FFT phase
Compute the FFT-phase spectrogram (rad.). The phase is displayed in the color palette selected by the profile's color scheme. Equally spaced color-steps for the defined phase-range are used. The first and last color-step is also used for values outside the display range.
phase range
Set the phase scale range (-p to p or 0 to 2p).
lock phase
If left unchecked, the FFT-phase is displayed without corrections. If checked, the phase relative to the segment begin is computed.
amp. masking
Enable or disable amplitude masking. If masking is enabled only the phase values of components above the minimum amplitude are displayed, all others are set to the value selected in the mask value box.
mask value
The value to set masked phase values to (in radians).
LOFAR
Compute the amplitude spectrum masked by the cepstrum smoothed spectrum.
cepstrum coefs.
Number of cepstrum coefficients which should be used to compute the smoothed spectrum. If this value is set to zero the number of cepstrum coefficients is set to: lfrm0.5 (with: lfrm = frame length in samples).
amp.-shift [dB]
Amplitude value to be added to the cepstrum before masking.
difference (sp-cp)
If checked, the cepstrum (+shift) is subtracted from the spectrum and only amplitudes above zero are displayed, otherwise the spectrum is masked by the cepstrum.
LPC transfer function
Compute the transfer function (amplitude) using the linear predictive coding (LPC) auto-correlation method.
lpc coefs.
Number of linear prediction coefficients. If set to zero, the number of coefficients is set to: srate/1000+4 (with: srate = sampling rate in Hz).
wavelet amplit. spectrum
Compute the wavelet spectrum using different wavelet functions and display the amplitudes or phases.
Function Type
This button selects the type of wavelet used for the transformation. Press the button to change the wavelet function. The wavelets Morlet, general-Gaussian, Laplace, f0-deriv-Gaussian, Mexican-Hat, Goupillaud and Morlett-II are implemented.
f0
The fundamental wavelet frequency for diladation 1.
window width
The cutoff sigma value for the Gaussian wavelet windowing function.
spectrum bins
Number of spectrum bins equally distributed over the full frequency range.
coef.
Exponent for the general Gaussian wavelet.
