Zooming in a Viewer
Zooming in a Viewer
It is now possible to magnify part of a graph using the zoom feature. You select part of the graph using the cursors and then select the desired axis for zooming from the context menu, or press one of the defined hotkeys.
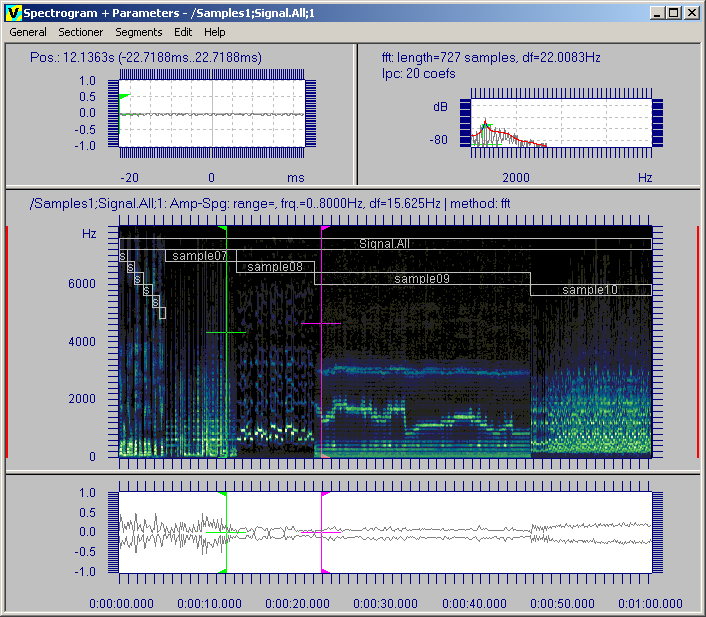
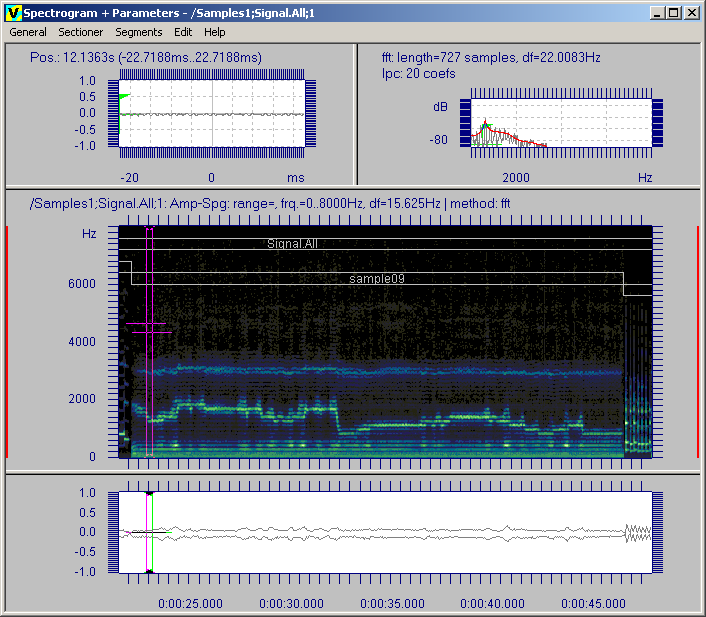
Here is a brand new spectrogram graph, with the cursor positions set.
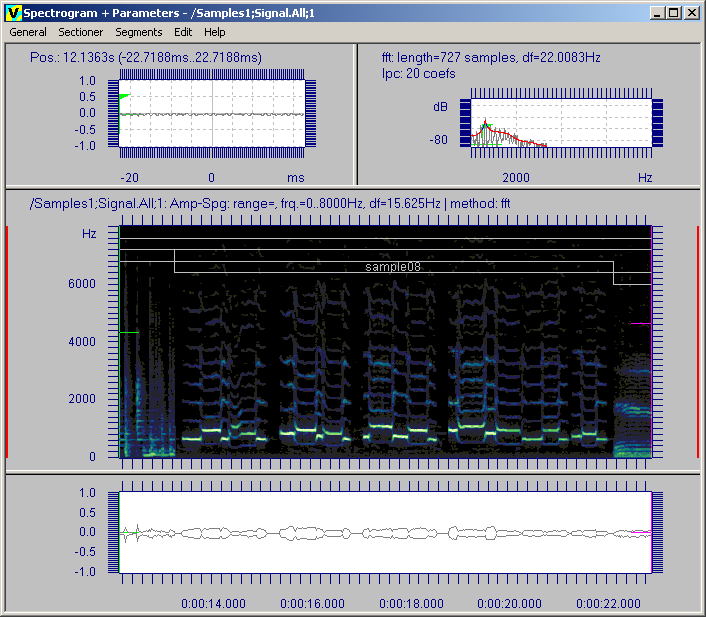
The hotkey 'V' was pressed to magnify the x axis between the cursors. The marked area is redisplayed in the same graph without having to recalculate the data.
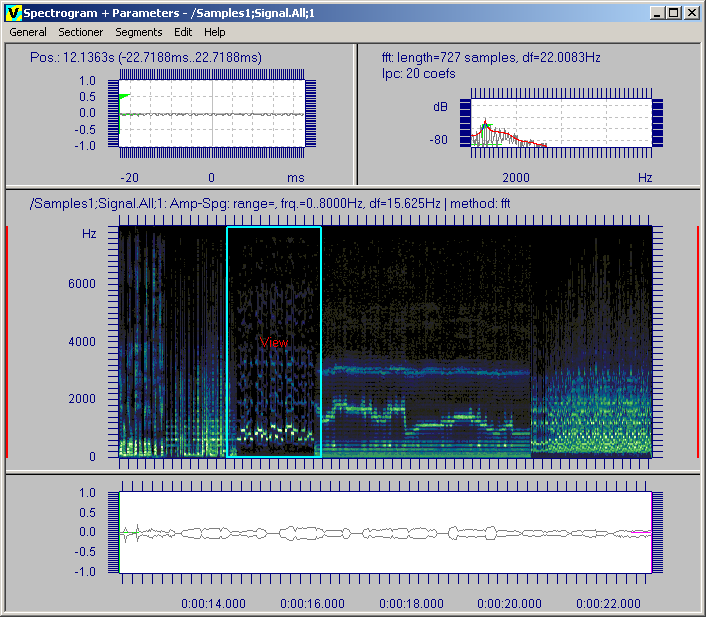
Once you have zoomed into part of a graph, you can see which part of the whole graph is visible by switching to the 'overview' mode (press the hotkey 'O').
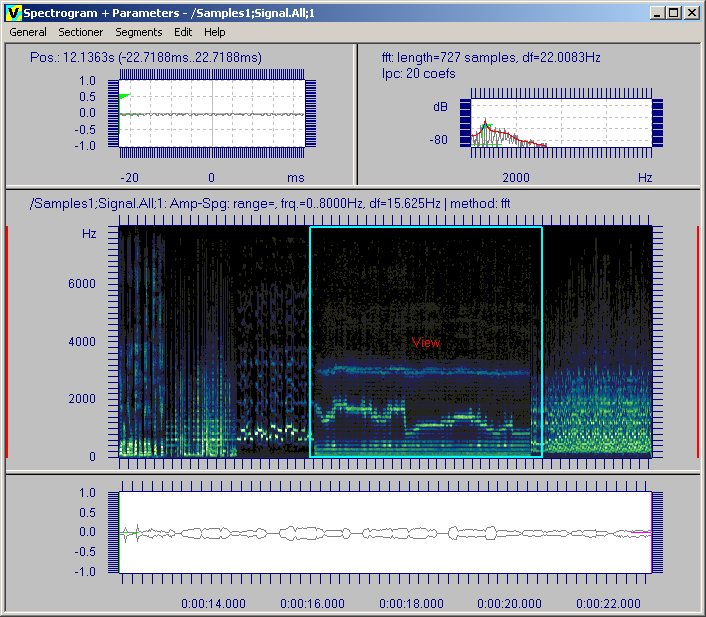
You can even move the 'view' area around.
When you switch back to the normal mode (hotkey 'O' again), that part of the graph is now displayed.
The zoom feature is only available if the 'enable zoom and autoscaling' checkbox in the profile's settings dialog is checked
If you have an older computer, need to make the graph analysis as quick as possible, and do not need the zoom feature, please turn it off. You may see marginal performance increase. If you do this, you can always 'zoom' into an area of a graph by doing another analysis (which is still available via the hotkey A or context menu item Analyse).
