Introducing Graph Items
| Graph Item | |||||
|---|---|---|---|---|---|
| INTRODUCTION | NEW | SET | ATTRIBUTES | MESSAGES | EXAMPLES |
The STx graph item is used to plot data on screen. Currently the following plot types are supported:
- spectrum
- parameter
- waveform
- spectrogram
- waterfall
The graph item also implements graphical cursors which can be used to extract values from the data via visual positioning, and segments to mark an area of the graph with text and coloured shapes.
Note that you cannot display a graph item without a display item (you need to specify the display on graph creation).
Contents
Plot Types
STx supports the following plot types:
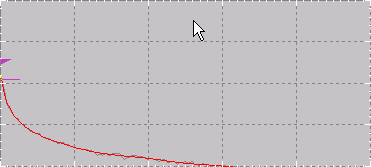
Spectrum Plot
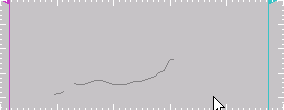
Parameter Plot
Waveform Plot
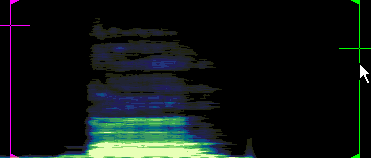
Spectrogram Plot
Waterfall Plot
Cursors
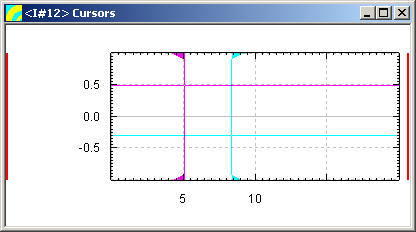
STx supports two cursors which the user can position within the graph using the mouse or the keyboard.
Cursor Selection
By default, neither cursor is selected. A selected cursor is displayed in a different colour on screen and the index of the selected cursor can be retrieved programmatically. Only one of the graph's cursors can be selected at any one time. If the user clicks on a cursor, that cursor is selected. If the user clicks on the graph itself, the selected cursor is deselected.
Note that you can select and deselect a cursor using the Programmer_Guide/Shell_Items/Graph/SET_GRAPH#CURSORPOS|CURSORPOS]] command.
A CURSORSELECTED or CURSORDESELECTED message is sent to the graph when a cursor is selected or deselected.
Connecting a Value Item to a Cursor
In order to extract the cursor position, the cursor must be connected to a value item. This is done by specifying the graph's cursor output as the value item's input:
#cursorInfo := new value *
$#cursorInfo input $#graph.cursors /Read
Reading Cursor Values
Once a cursor has been attached to a value item, the values of the cursors can be accessed via the value item's !DATA attribute:
// retrieve the x and y value of the first cursor (cursor 1)
#x := $#cursorInfo[!data,5]
#y := $#cursorInfo[!data,6]
Cursor Status Value Item Vector
The value item's !DATA attribute has the following 20 indices defined for cursor status information:
| index | description |
|---|---|
| 0 | index of selected cursor (1 or 2) or 0 if no cursor is selected |
| 1 | index (>=0) of function if cursor is bound and <0 if not bound |
| 2 | control command code (*). 1 if the control key is pressed, 2 if the shift key is pressed, 3 if both control and shift are pressed, 0 otherwise
|
| 3 | not used |
| 4 | cursor style (index) |
| 5/10 | x position of first (5) and second (10) cursor |
| 6/11 | y position of first (6) and second (11) cursor |
| 7/12 | index of function value addressed by first (7) and second (12) cursor (only if function bound) |
| 8/13 | not used |
| 8/14 | not used |
| 15 | x position of control command (*) |
| 16 | y position of control command (*) |
| 17-19 | not used |
(*) A control command is sent when the control or shift key is held and the left mouse button is pressed inside the graphs draw region. This feature was implemented for real-time tagging in the Recorder application
Setting Cursor Positions
A cursor position can be set programmatically using the graph command SET graph CURSORPOS.


