User Guide/SPExL/Transcription Script/Settings
From STX Wiki
Jump to navigationJump to search
Contents
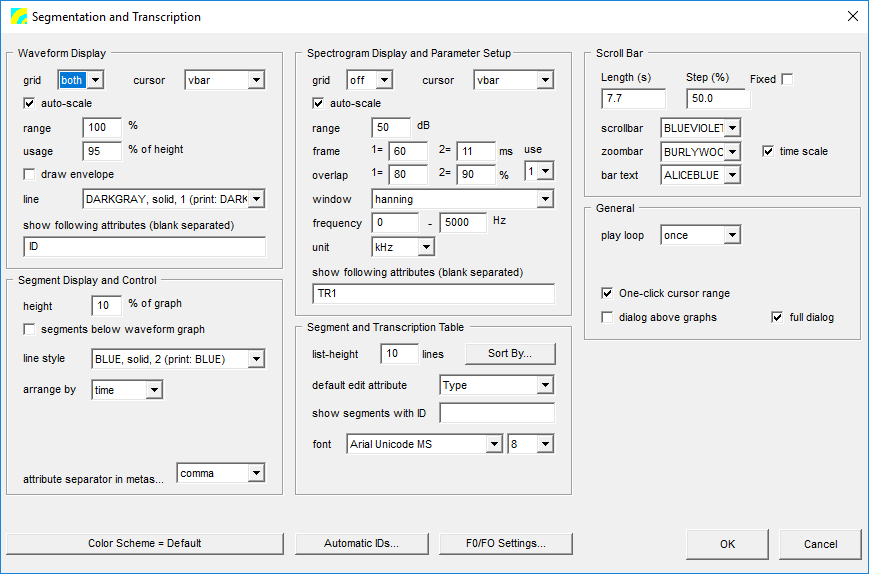
Waveform Display
- grid
- Display a grid in the waveform display.
- cursor
- Change the default cursor style.
- auto-scale
- If checked, the y-axis waveform range is calculated automatically. If it is not checked, then the values range and usage are used.
- range
- A value between 0 and 100. A value of 100 sets the maximum y range to the maximum possible amplitude. This value is ignored if auto-scale is turned on.
- usage
- A value between 0 and 100. The percentage of the window height to use for the waveform display.
- draw envelope
- If checked, draw the envelope of the wave form, otherwise, use a solid fill.
- line
- Specify the waveform color.
- show following attributes (blank separated)
- Specify which attributes to display in the segments. The default is the segment ID.
Segment Display and Control
- height
- The height of the graph to use for one segment. If you have a lot of overlapping segments, this may have to be reduced.
- segments below waveform graph
- If you prefer, you can start drawing the segments from the bottom of the graph. If you do not want the segments drawn over the waveform, you can either reduce the height, or reduce the usage value.
- line style
- Choose the segment color.
- arrange by
- Choose whether segments should be ordered by their time values (making sure they don't overlap) or by an attribute. If arranged by attribute, you must specify which attribute will be used, and which values to put into different lines. For example, if you have an attribute 'Type' with possible values like 'uttr', 'word' and 'phon', specify 'uttr word phon' in the values (separated by blanks) box.
- values (separated by blanks)
- A list of attributes to put on different lines. Any other attribute values will be put on the same line.
- attribute separator in metasegment text
- If you specify more than one attribute to display in the segments (see show following attributes (blank separated)), you can choose to separate them with a comma, a semi-colon, or a new line.
Spectrogram Display and Parameter Setup
- grid
- Turn the graph background grid on or off.
- cursor
- Set the cursor style.
- auto-scale
- If on, then the spectrogram floor is automatically calculated. Otherwise, set the floor dB value (a value <= 0).
- range
- The dB range to use for minimum/maximum amplitude values.
- frame
- The analysis frame length in milliseconds
- overlap
- The frame overlap in percent.
- use
- There are two frame/overlap settings. Specify which one to use for display. You can toggle between them in by using the frm= combobox.
- window
- Select the window to use for analysis.
- frequency
- The spectrogram frequency range.
- unit
- The spectrogram frequency (y-axis) unit.
- show following attributes (blank separated)
- The list of segment attributes to display as segment text. If none are specified, the segment ID is used.
Segment and Transcription Table
- list-height
- The height of the segment listbox. This is in dialog units, so the number of segments actually displayed may be more than the 'height' specified.
- Sort By..
- Choose which attributes to sort the list by default.
- default edit attribute
- The first attribute to edit when creating a new segment.
- show segments with id
- Filter which segments to display by specifying a wildcard string. E.g. word.* would only display segments beginning with word..
- font
- Specify the font to use for segment text.
Scroll Bar
- Length (s)
- Specify the length of the scrollbar in seconds.
- Step (%)
- Specify the length as a percentage of the scroll bar to use to step to the next section of the sound file.
- Fixed
- Specify if you can change the length of the scroll bar.
- scrollbar
- Specify the colour of the scroll bar.
- zoombar
- Specify the colour of the zoom bar.
- bar text
- Specify the colour of the text in the scroll and zoom bars.
General
- play loop
- Specify if playback should loop or not.
- pause
- The duration of the pause between repetitions.
- One-click cursor range
- If checked, you can click and drag in a graph to set the cursor range. If not checked, you must click on a specific cursor to move it.
- dialog above graphs
- If checked, the dialog is displayed above the graphs. Otherwise it is displayed below the graphs.
- full dialog
- If checked, then the full dialog is displayed (with playback, cursor control, zoom and view, and segments buttons). If unchecked, these are not displayed, although the functionality is still available via, e.g., hotkeys.
Color Scheme
Choose which color scheme to use for the graphs. See the Color Schemes for details.
Automatic IDs...
Specify how automatic IDs for new segments should be generated. See Automatic Segment Names for details.
F0/FO Settings...
Specify the F0 and formant settings.
