|
|
| (6 intermediate revisions by the same user not shown) |
| Line 1: |
Line 1: |
| {{DISPLAYTITLE:{{SUBPAGENAME}}}} | | {{DISPLAYTITLE:{{SUBPAGENAME}}}} |
| [[Category:Graph Item]]
| | {{Graph Item}} |
| The {{STX}} graph item is used to plot data on screen. Currently the following plot types are supported: | | The {{STX}} graph item is used to plot data on screen. Currently the following plot types are supported: |
| * spectrum | | * spectrum |
| Line 45: |
Line 45: |
| By default, neither cursor is selected. A selected cursor is displayed in a different colour on screen and the index of the selected cursor can be retrieved programmatically. Only one of the graph's cursors can be selected at any one time. If the user clicks on a cursor, that cursor is selected. If the user clicks on the graph itself, the selected cursor is deselected. | | By default, neither cursor is selected. A selected cursor is displayed in a different colour on screen and the index of the selected cursor can be retrieved programmatically. Only one of the graph's cursors can be selected at any one time. If the user clicks on a cursor, that cursor is selected. If the user clicks on the graph itself, the selected cursor is deselected. |
|
| |
|
| Note that you can select and deselect a cursor using the <code>CURSORPOS</code> command. | | Note that you can select and deselect a cursor using the <code>Programmer_Guide/Shell_Items/Graph/SET_GRAPH#CURSORPOS|CURSORPOS]]</code> command. |
|
| |
|
| A message is sent to the graph when a cursor is selected or deselected. | | A [[Programmer_Guide/Shell_Items/Graph/GRAPH_Messages#CURSORSELECTED|CURSORSELECTED]] or [[Programmer_Guide/Shell_Items/Graph/GRAPH_Messages#CURSORDESELECTED|CURSORDESELECTED]] message is sent to the graph when a cursor is selected or deselected. |
|
| |
|
| ===Connecting a Value Item to a Cursor=== | | ===Connecting a Value Item to a Cursor=== |
| Line 98: |
Line 98: |
| |} | | |} |
|
| |
|
| <span id="marke61245">(*)</span> A control command is sent when the control or shift key is held and the left mouse button is pressed inside the graphs draw region. This feature was implemented for ''real-time tagging'' in the [[User_Guide/Recorder/Recorder|Recorder]] application | | <span id="marke61245">(*)</span> A control command is sent when the control or shift key is held and the left mouse button is pressed inside the graphs draw region. This feature was implemented for ''real-time tagging'' in the [[User_Guide/Recorder|Recorder]] application |
|
| |
|
| ===Setting Cursor Positions=== | | ===Setting Cursor Positions=== |
|
| |
|
| A cursor position can be set programmatically using the graph command [[Programmer_Guide/Shell_Items/Graph/SET_GRAPH#CURSORPOS|<code>SET <var>graph</var> CURSORPOS</code>]]. | | A cursor position can be set programmatically using the graph command [[Programmer_Guide/Shell_Items/Graph/SET_GRAPH#CURSORPOS|<code>SET <var>graph</var> CURSORPOS</code>]]. |
|
| |
| ==Graph Examples==
| |
|
| |
| The following scripts demonstrate some of the display, graph and dialog functionality. An alternative to the examples below is to use the macros and classes available (e.g. [[Programmer_Guide/Macro_Library/XPlot|<code>XPLOT</code>]] for graphs, [[Programmer_Guide/Macro_Library/ModalDialog|<code>ModalDialog</code>]] for dialogs etc.
| |
|
| |
| ===Graph Script Example===
| |
|
| |
| A basic script displaying an x/y plot.
| |
|
| |
| <pre>
| |
| /*++
| |
| Macro: gui_basic_example
| |
| Descriptions:
| |
| Creates a basic graphical user interface,
| |
| Parameters:
| |
| #standalone Set to 1 if the script is running on it's own
| |
| (i.e. not called by another script). This is the default.
| |
| Otherwise set to 0.
| |
| Author:
| |
| Jonnie White
| |
| History:
| |
| 2006-11-13 First implemented
| |
| 2007-10-04 Dialog button now toggles function color
| |
| 2009-06-25 Modernising
| |
| --*/
| |
| [macro gui_basic_example #standalone=1]
| |
| //
| |
| // create and configure display
| |
| //
| |
| #display := new display * 'Display Title' 1 1 /Dialog=Above
| |
| if '$#display[?]' != 'display' then
| |
| em -1 ; display creation failed ($emsg)
| |
| end
| |
| $#display enabled restore 0 0 600 600
| |
| //
| |
| // create spu to generate data for graph
| |
| //
| |
| // generate some data
| |
| #nValues := 100
| |
| #vector := eval fill($#nValues,0,1)
| |
| // create and run spu
| |
| #spu := new spu * table2output $#vector 1 0 1 /n
| |
| if '$#spu[?]' != 'spu' then
| |
| em -1 ; spu creation failed ($emsg)
| |
| end
| |
| //
| |
| // create and configure graph
| |
| //
| |
| #graph := new graph * 1 $#display 0 0
| |
| if '$#graph[?]' != 'graph' then
| |
| em -1 ; graph creation failed ($emsg)
| |
| end
| |
| theGraph := $#graph // shell variable used for graph commands in message handler
| |
| $#graph axis both both * yellow both both
| |
| $#graph xscale 0 $#nValues-1 '' 'X'
| |
| $#graph yscale 0 $#nValues-1 '' 'Y'
| |
| $#graph y 0 $#spu.x0 xyplot 1 green lines solid 2
| |
| $#graph x $#spu.x0 /a // set x data and apply all graph settings
| |
| //
| |
| // run spu (sending data to graph
| |
| //
| |
| $#spu run 1
| |
| // return if this is not a standalone call
| |
| // caller should clean up
| |
| if '$#standalone' != 1 exit 1
| |
| //
| |
| // create and configure the dialog
| |
| //
| |
| #dialog := new menu * $#display
| |
| if '$#dialog[?]' != 'menu' then
| |
| em -1 ; dialog creation failed ($emsg)
| |
| end
| |
| $#dialog $#dialog[!controls] button 0 0 'Toggle function color'
| |
| $#dialog enabled restored
| |
| //
| |
| // process messages until display is close
| |
| // by the user
| |
| //
| |
| setmsghandler display $#display gui_basic_example_mh
| |
| //
| |
| // process dialog messages too
| |
| //
| |
| setmsghandler menu $#dialog gui_basic_example_mh
| |
| AppMode := 1
| |
| do while '$AppMode' != '0'
| |
| GetMessage
| |
| end
| |
| setmsghandler display $#display
| |
| //
| |
| // clean up
| |
| //
| |
| delete $#graph $#display $#dialog $#spu
| |
| exit
| |
|
| |
| [MACRO gui_basic_example_mh #objtype #objname #msgid #msgpar]
| |
| if '$#objtype' == display || '$#objtype' == shell then
| |
| if '$#msgid' == Close || '$#msgId' == Exit then
| |
| AppMode := 0
| |
| end
| |
| else if '$#objtype' == 'menu' then
| |
| if '$#msgid' == 'command' && '$#msgpar' == '0' then
| |
| // toggle function color
| |
| fcolor := COND '$fcolor' == 'green' || '$fcolor' == '' ? 'blue' : 'green'
| |
| $theGraph y 0 * * * $fcolor * * * /Apply
| |
| end
| |
| end
| |
| exit 1
| |
| </pre>
| |
|
| |
| ===Cursor Script Example===
| |
|
| |
| The following {{STX}} script example demonstrates basic use of the graphical cursors.
| |
|
| |
| <pre>
| |
| [macro gui_cursors_example #standalone=1]
| |
| //
| |
| // create display, graph and dialog
| |
| // and configure
| |
| //
| |
| if '$#standalone' == 1 then
| |
| if '$(load macrocode $scriptdirectory\gui_basic_example.sts)' > 0 em $rc ; $#mac - $emsg
| |
| gui_basic_example 0
| |
| end
| |
| //
| |
| // display cursor styles combobox in dialog
| |
| // and static control for cursor position values.
| |
| //
| |
| cursorStyle := set '0'
| |
| cursorStyleList := set 'cross crosshair hbar vbar hbarcross vbarcross harmonic rangeselection'
| |
| functionBound := set '0'
| |
| functionBoundList := set 'unbound bound'
| |
| //
| |
| // show cursors in graph
| |
| //
| |
| $myGraph cursormode both $cursorStyle on $(int $functionBound-1) off off red yellow /Apply
| |
| //
| |
| // connect them with a value item, so the value can be
| |
| // extracted at any time using the syntax $cursors[!data,$#i]
| |
| //
| |
| myCursors := new value *
| |
| if '$myCursors[?]' != 'value' em -1 ; value creation failed ($emsg)
| |
| $myCursors input $myGraph.cursors /Read
| |
| //
| |
| // return if this is not a standalone call
| |
| //
| |
| if '$#standalone' != 1 exit 1 // caller will clean up
| |
| //
| |
| // create dialog controls and show
| |
| // the display
| |
| //
| |
| $myDialog $myDialog[!controls] combobox 0 0 'Cursor Style' cursorStyle * * cursorStyleList
| |
| functionBound := set '0'
| |
| functionBoundList := set 'unbound bound'
| |
| $myDialog $myDialog[!controls] combobox 1 0 'Function Bound' functionBound * * functionBoundList
| |
| staticCtrlId := $myDialog[!controls]
| |
| $myDialog $staticCtrlId static 2 0 'text' * 50 1
| |
| $myDialog enabled restored /Write // update dialog
| |
| $myDisplay enabled restored 100 100 800 800
| |
| //
| |
| // process messages until display is close
| |
| // by the user
| |
| //
| |
| setmsghandler display $myDisplay gui_cursors_example_mh
| |
| setmsghandler menu $myDialog gui_cursors_example_mh
| |
| setmsghandler value $myCursors gui_cursors_example_mh
| |
| AppMode := 1
| |
| do while '$AppMode' != '0'
| |
| GetMessage
| |
| end
| |
| setmsghandler display $myDisplay
| |
| setmsghandler menu $myDialog
| |
| setmsghandler value $myCursors
| |
| //
| |
| // clean up
| |
| //
| |
| delete $myGraph $myDisplay $myDialog $mySpu $myCursors
| |
| exit
| |
|
| |
| [MACRO gui_cursors_example_mh #objtype #objname #msgid #msgpar]
| |
| if '$#objtype' == display || '$#objtype' == shell then
| |
| if '$#msgid' == Close || '$#msgId' == Exit then
| |
| AppMode := 0
| |
| end
| |
| else if '$#objtype' == 'menu' then
| |
| if '$#msgid' == 'update' then
| |
| $#objname /Read // retrieve new
| |
| $myGraph cursormode both $(word $cursorStyle $cursorStyleList) * $(int $functionBound-1) /Apply
| |
| end
| |
| else if '$#objtype' == 'value' then
| |
| if '$#objname' == '$myCursors' then
| |
| #x1 := format '%.2f' $myCursors[!data,5]
| |
| #y1 := format '%.2f' $myCursors[!data,6]
| |
| #x2 := format '%.2f' $myCursors[!data,10]
| |
| #y2 := format '%.2f' $myCursors[!data,11]
| |
| $myDialog $staticCtrlId * 'x1=$#x1 y1=$#y1 x2=$#x2 y2=$#y2'
| |
| end
| |
| end
| |
| exit 1
| |
| </pre>
| |
|
| |
| ===Color Settings Script Example===
| |
|
| |
| The following script demonstrates how to set a graphs colors, fonts etc.
| |
|
| |
| <pre>
| |
| [macro gui_colors_example #standalone=1]
| |
| //
| |
| // create display, graph and dialog
| |
| // and configure, display cursors
| |
| //
| |
| if '$#standalone' == 1 then
| |
| if '$(load macrocode $scriptdirectory\gui_basic_example.sts)' > 0 em $rc ; $#mac - $emsg
| |
| gui_basic_example 0
| |
| if '$(load macrocode $scriptdirectory\gui_cursors_example.sts)' > 0 em $rc ; $#mac - $emsg
| |
| gui_cursors_example 0
| |
| end
| |
| //
| |
| // configure graph
| |
| //
| |
| // the title (top left) of the graph
| |
| $myGraph title on 'arial:13:italic' black 'Graph Title'
| |
| // axis data range, units and title
| |
| // this data is used for the labels as well as the cursor
| |
| // position data.
| |
| $myGraph xscale 0 $#nValues-1 'X Unit' 'X Title'
| |
| $myGraph yscale 0 $#nValues-1 'Y Unit' 'Y Title'
| |
| // colors / fonts / labels etc
| |
| // specify the background color
| |
| $myGraph bgcolor hlgray white
| |
| // specify which axes labels to display, the font and color to use
| |
| $myGraph axis below left 'courier:10' gray below left 'arial:12:bold' black on on
| |
| // specify which axes to display and whether to display a grid or not
| |
| // and the number of steps between labels (ticks).
| |
| $myGraph frame below left gray both gray 5 5 -20 -10
| |
| // plot type and data source
| |
| $myGraph y 0 * * 1 red lines solid 3
| |
| // cursors
| |
| $myGraph cursormode both cross on 0 off off red yellow /Apply
| |
| //
| |
| // set the display position
| |
| //
| |
| $myDisplay enabled restored 100 100 800 800
| |
| //
| |
| // process messages until display is close
| |
| // by the user
| |
| //
| |
| setmsghandler display $myDisplay gui_colors_example_mh
| |
| AppMode := 1
| |
| do while '$AppMode' != '0'
| |
| GetMessage
| |
| end
| |
| setmsghandler display $myDisplay
| |
| //
| |
| // clean up
| |
| //
| |
| delete $myGraph $myDisplay $myDialog $mySpu $myCursors
| |
| exit
| |
|
| |
| [MACRO gui_colors_example_mh #objtype #objname #msgid #msgpar]
| |
| if '$#objtype' == display || '$#objtype' == shell then
| |
| if '$#msgid' == Close || '$#msgId' == Exit then
| |
| AppMode := 0
| |
| end
| |
| end
| |
| exit 1
| |
| </pre>
| |
|
| |
| == Further reading ==
| |
| * See the [[Programmer_Guide/Shell_Items/Graph/NEW_GRAPH|NEW GRAPH]] command for generating a graph.
| |
| * See the [[Programmer_Guide/Shell_Items/Graph/SET_GRAPH|SET GRAPH]] command for manipulating a graph.
| |
| * See [[Programmer_Guide/Shell_Items/Graph/GRAPH_Messages|GRAPH Messages]] for messages generated by graph items.
| |
| * See [[Programmer_Guide/Shell_Items/Graph/GRAPH_Item_Attributes|GRAPH Item Attributes]] for an overview over the attributes of graph items.
| |
The STx graph item is used to plot data on screen. Currently the following plot types are supported:
- spectrum
- parameter
- waveform
- spectrogram
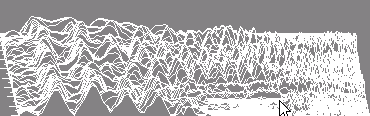
- waterfall
The graph item also implements graphical cursors which can be used to extract values from the data via visual positioning, and segments to mark an area of the graph with text and coloured shapes.
Note that you cannot display a graph item without a display item (you need to specify the display on graph creation).
Plot Types
STx supports the following plot types:
Spectrum Plot
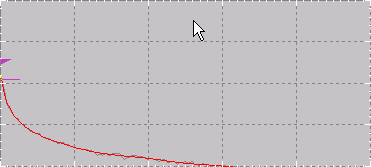
Parameter Plot
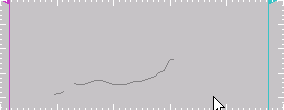
Waveform Plot
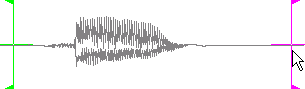
Spectrogram Plot
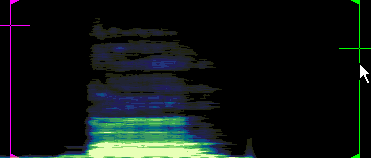
Waterfall Plot
Cursors
STx supports two cursors which the user can position within the graph using the mouse or the keyboard.
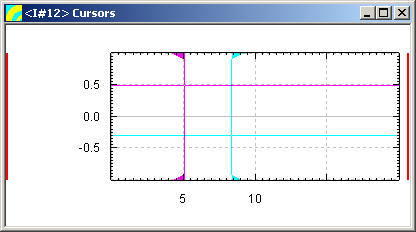
Cursor Selection
By default, neither cursor is selected. A selected cursor is displayed in a different colour on screen and the index of the selected cursor can be retrieved programmatically. Only one of the graph's cursors can be selected at any one time. If the user clicks on a cursor, that cursor is selected. If the user clicks on the graph itself, the selected cursor is deselected.
Note that you can select and deselect a cursor using the Programmer_Guide/Shell_Items/Graph/SET_GRAPH#CURSORPOS|CURSORPOS]] command.
A CURSORSELECTED or CURSORDESELECTED message is sent to the graph when a cursor is selected or deselected.
Connecting a Value Item to a Cursor
In order to extract the cursor position, the cursor must be connected to a value item. This is done by specifying the graph's cursor output as the value item's input:
#cursorInfo := new value *
$#cursorInfo input $#graph.cursors /Read
Reading Cursor Values
Once a cursor has been attached to a value item, the values of the cursors can be accessed via the value item's !DATA attribute:
// retrieve the x and y value of the first cursor (cursor 1)
#x := $#cursorInfo[!data,5]
#y := $#cursorInfo[!data,6]
Cursor Status Value Item Vector
The value item's !DATA attribute has the following 20 indices defined for cursor status information:
| index |
description
|
| 0 |
index of selected cursor (1 or 2) or 0 if no cursor is selected
|
| 1 |
index (>=0) of function if cursor is bound and <0 if not bound
|
| 2 |
control command code (*). 1 if the control key is pressed, 2 if the shift key is pressed, 3 if both control and shift are pressed, 0 otherwise
|
| 3 |
not used
|
| 4 |
cursor style (index)
|
| 5/10 |
x position of first (5) and second (10) cursor
|
| 6/11 |
y position of first (6) and second (11) cursor
|
| 7/12 |
index of function value addressed by first (7) and second (12) cursor (only if function bound)
|
| 8/13 |
not used
|
| 8/14 |
not used
|
| 15 |
x position of control command (*)
|
| 16 |
y position of control command (*)
|
| 17-19 |
not used
|
(*) A control command is sent when the control or shift key is held and the left mouse button is pressed inside the graphs draw region. This feature was implemented for real-time tagging in the Recorder application
Setting Cursor Positions
A cursor position can be set programmatically using the graph command SET graph CURSORPOS.


