User Guide/SPExL/Transcription Script/Settings: Difference between revisions
From STX Wiki
< User Guide | SPExL | Transcription Script
Jump to navigationJump to search
| Line 11: | Line 11: | ||
;show following attributes (blank separated):Specify which attributes to display in the segments. The default is the segment ID. | ;show following attributes (blank separated):Specify which attributes to display in the segments. The default is the segment ID. | ||
==Segment Display and Control== | ==Segment Display and Control== | ||
;height:The height of the graph to use for one segment. If you have a lot of overlapping segments, this may have to be reduced. | |||
;segments below waveform graph: If you prefer, you can start drawing the segments from the bottom of the graph. If you do not want the segments drawn over the waveform, you can either reduce the '''height''', or reduce the '''usage''' value. | |||
;line style:Choose the segment color. | |||
;arrange by:Choose whether segments should be ordered their time (making sure they don't overlap) or by an attribute. | |||
==Spectrogram Display and Parameter Setup== | ==Spectrogram Display and Parameter Setup== | ||
Revision as of 10:45, 10 October 2017
Contents
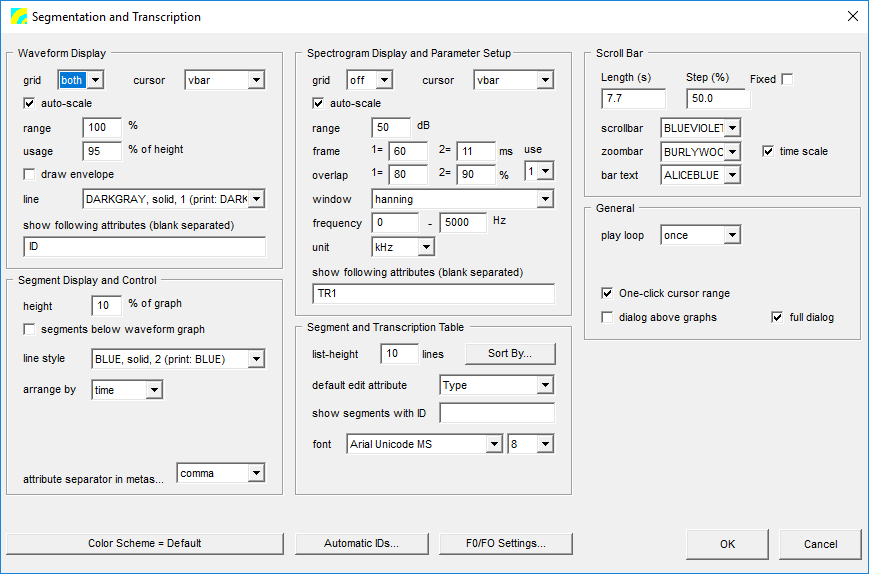
Waveform Display
- grid
- Display a grid in the waveform display.
- cursor
- Change the default cursor style.
- auto-scale
- If checked, the y-axis waveform range is calculated automatically. If it is not checked, then the values range and usage are used.
- range
- A value between 0 and 100. A value of 100 sets the maximum y range to the maximum possible amplitude. This value is ignored if auto-scale is turned on.
- usage
- A value between 0 and 100. The percentage of the window height to use for the waveform display.
- draw envelope
- If checked, draw the envelope of the wave form, otherwise, use a solid fill.
- line
- Specify the waveform color.
- show following attributes (blank separated)
- Specify which attributes to display in the segments. The default is the segment ID.
Segment Display and Control
- height
- The height of the graph to use for one segment. If you have a lot of overlapping segments, this may have to be reduced.
- segments below waveform graph
- If you prefer, you can start drawing the segments from the bottom of the graph. If you do not want the segments drawn over the waveform, you can either reduce the height, or reduce the usage value.
- line style
- Choose the segment color.
- arrange by
- Choose whether segments should be ordered their time (making sure they don't overlap) or by an attribute.
Spectrogram Display and Parameter Setup
- frame
- The analysis frame length in milliseconds
- overlap
- The frame overlap in percent.
- use
- There are two frame/overlap settings. Specify which one to use for display. You can toggle between them in SPExL using the frm= combobox.
